


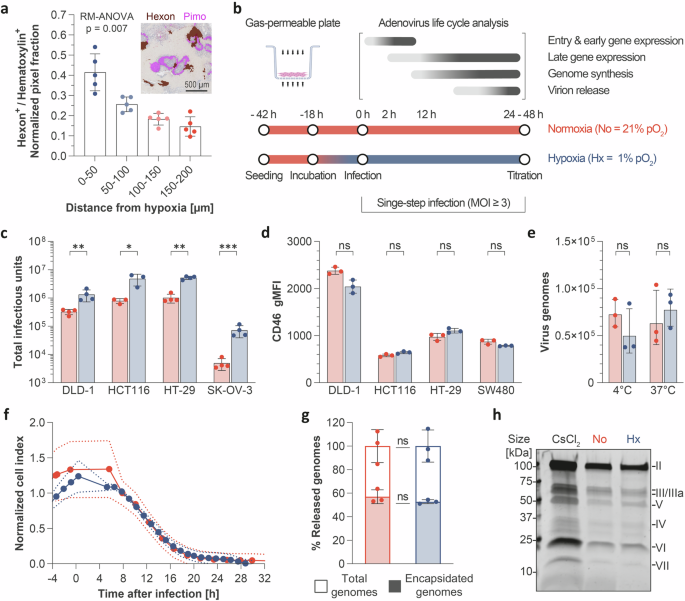
Spatial proximity evaluation of adenovirus foci and hypoxia
Animal experimentation was performed beneath moral approval from the UK Residence Workplace (Challenge license 30/3391 and private license I5916669E). Feminine CB17-SCID mice (6–8 weeks outdated) have been inoculated subcutaneously in the correct flank with 2 × 10⁶ DLD-1 cells in 50 µL. On day 1, when xenografts reached 80–120 mm3, mice obtained 100 µL of chlodronate liposomes (Chlodronateliposomes.org) intravenously to maximise subsequent adenovirus supply.54 EnAd-SA-fLuc reporter virus particles (2 × 10¹⁰) have been injected through the tail vein on days 2 and 4. Throughout steady-state an infection, beforehand proven to be 16 days after the final remedy,12 mice have been injected intraperitoneally with pimonidazole at 60 mg·kg−1 and have been culled 2 h later. Tumors have been explanted, formalin-fixed, and paraffin-embedded.
Eight pairs of serial tissue sections per tumor (4 µm thick, ca. 40 µm aside, 4 pairs for mouse 3) have been stained for hexon (horseradish peroxidase/3,3´-diaminobenzidine), pimonidazole adducts (alkaline phosphatase/Quick purple), and nuclei (hematoxylin) as beforehand described.12 Spatial proximity between hexon-positive adenovirus foci and hypoxic areas was analyzed utilizing a customized pipeline in Fiji/ImageJ.55 Briefly, matched serial sections have been scanned at 20x (Aperio ImageScope, Leica), aligned, cropped to tissue boundaries, and cleaned of staining artifacts. Binary masks have been generated from color-deconvolved alerts utilizing depth thresholding. The pimonidazole masks was skeletonized to render an Euclidean distance map extending 200 µm outward from the core/skeleton of pimonidazole staining. Hexon- and hematoxylin-positive areas, representing nuclei in viable tumor areas, have been projected onto this map to extract the normalized pixel fraction as a operate of distance from the pimonidazole skeleton. An in depth framework is offered in Supplementary Fig. 1.
Cell strains
DLD-1, SW480, SK-OV-3, HCT116, HT29 (ATCC), and AD293 (Agilent Applied sciences) have been cultured in DMEM (Sigma Aldrich) with 10% (v/v) heat-inactivated fetal bovine serum (FBS, Gibco) at 37 °C and 5% CO2. Cell strains have been maintained in a humidified incubator, routinely examined for mycoplasma (Lonza), and authenticated (Supply Bioscience).
Hypoxia remedy
Hypoxia incubation (1% pO2) was carried out within the In vivo2 400 chamber (Baker Ruskin) utilizing media pre-equilibrated in a single day at 1% pO₂. Experiments utilized gas-permeable Lumox® plates (Sarstedt) on a zig-zag rocker (PMR-30, VWR) at 5 cycles per minute to keep up gasoline equilibrium. Exterior oxygen calibration of the chamber was carried out routinely. Pharmacological hypoxia was induced with 50 µM FG4592 (Roxadustat, Cayman Chemical).
Viruses and infections
EnAd-E1A-cFLAG, used for E1A expression evaluation, was generated utilizing a shuttle plasmid containing the E1A open studying body flanked by NdeI websites within the pColoAd2.4 vector.23 Cloning of this virus is summarized in Supplementary Figs. 3 and 4. EnAd-SA-fLuc, utilized in experiments monitoring viral life cycle, accommodates a firefly luciferase coupled to the main late transcription unit by a splice acceptor sequence.23 EnAd-CMV-BiTE and EnAd-SA-BiTE specific a deca-His-tagged EpCAM/CD3-BiTE beneath a CMV promoter or built-in into the late transcription unit through a splice acceptor, respectively.25 Ad5-E1A-fLuc is a replication-competent reporter adenovirus encoding firefly luciferase fused to E1A.56 Virus shares have been concentrated and double-purified through cesium chloride gradient centrifugation, then titered by plaque assay on A549 cells as beforehand described.12
Infections have been carried out in serum-free media for two h. For virus manufacturing, inocula have been eliminated, and cells have been washed twice with full medium. The inoculum was set to 125 μL·cm−2 impartial of the seeding format, and MOIs have been based mostly on titers derived by plaque assay (Supplementary Desk 2).
Quantification of infectious adenovirus particles utilizing bioluminescence
A high-dynamic-range technique was established to measure infectious viral particles by correlating gentle emitted by reporter adenoviruses of unknown focus with plaque assay-tittered requirements (Supplementary Fig. 2). Phenol red-free supernatants from virus manufacturing assays with EnAd-SA-fLuc have been collected, weighed, and cleared by centrifugation. Neat or diluted 25 µL samples, together with a regular collection (5.57 × 10⁵ PFU·mL−1 2.72 × 10² PFU·mL−1), have been used to contaminate 1.5 × 10⁴ A549 cells seeded the day past in 50 µL phenol red-free DMEM + 10% FBS (Gibco) on strong black 96-well plates (Corning). Plates have been then spun at 600×gn for 10 min. At 20 to 24 hpi, luminescence was measured utilizing a PolarStar plate reader (BMG Labtech) after injecting 25 µL of a 1.2 mg·mL−1 D-Luciferin resolution into the effectively (Gold Biotechnology). Bioluminescence was recorded over six kinetic cycles at 0.5 s intervals, and virus concentrations have been calculated through four-parameter becoming of built-in luminescence (MARS, BMG Labtech). Not less than three technical replicates have been carried out for every an infection.
Assay for capsid integrity
To investigate the protein composition of adenovirus particles in supernatants, the tradition medium was centrifuged (300×gn, 5 min), filtered (0.22 µm), and concentrated utilizing a 300 kDa cut-off ultrafiltration unit (Sartorius). The retentate was washed twice with PBS, and protein focus was measured utilizing the QuantiPro BCA Equipment (Thermo Fisher). Two micrograms of lysate in RIPA buffer (Thermo Fisher) have been separated as for immunoblotting, stained with SyproRuby (Thermo Fisher) and imaged on a Biorad Chemidoc imager.
Absolute quantification of viral mRNA and genomic DNA by qPCR
DNA was extracted from contaminated cell pellets or supernatants utilizing the PureLink genomic DNA Mini Equipment (Invitrogen), and whole RNA utilizing RNeasy Mini Equipment (Qiagen). RNA integrity was routinely examined by capillary electrophoresis (Tape Station, Agilent). For cDNA synthesis, 500 to 800 ng of RNA was transcribed utilizing the QuantiTect Equipment (Qiagen). PCR reactions (20 µL) contained 10 ng of cDNA or DNA with 2x qPCRBIO Probe Combine Hello-ROX (TaqMan assays, PCR Biosystems). Fiber, E1A, and E2B 200 bp-standards for absolute quantification have been synthesized (IDT Applied sciences, Supplementary Fig. 7). Fiber detection was used to quantify genome copy quantity. TaqMan probes have been labeled with JOE or FAM and quenched with BHQ1 (Sigma). Measurements have been carried out on the StepOnePlus cycler (Utilized Biosciences). Copy numbers have been calculated by linear regression on normal curves (Supplementary Fig. 7). Primer sequences can be found in Supplementary Desk 3.
To quantify encapsidated genomes, 200 µL of contaminated supernatants have been handled with 100U Benzonase (Millipore) for 3 h at 37 °C. Earlier than DNA extraction and fiber quantification by qPCR, benzonase was inactivated with EDTA (0.1 M remaining focus) and heat-inactivation at 80 °C for 10 min.
Movement cytometry
Cells have been indifferent utilizing cell dissociation buffer (GIBCO), stained for 10 min with LIVE/DEAD fixable near-infrared staining equipment (1:5000, Thermo Fisher), after which mounted in 2% neutral-buffered formalin for 10 min (Sigma). Antigens have been blocked in 2 mM EDTA + 0.5% BSA with Fc-block (1:100, Biolegend) in PBS for 20 min. Cells have been then stained with anti-CD46 antibody (1:200, clone TRA-2-10, Biolegend) or the corresponding isotype management for 30 min in PBS + 2 mM EDTA + 0.5% BSA. Stained cells have been measured on the FACSCalibur stream cytometer (BD Biosciences). Evaluation was carried out on cell populations excluding particles, doublets and lifeless cells.
Actual-time monitoring of cytopathic impact
Lack of cell adhesion as a result of cytopathic impact was monitored in real-time utilizing the xCELLigence RTCA DP instrument (Roche). xCELLigence plates have been equilibrated with 50 µL of medium for 1 h to determine a baseline. Then, 10,000 cells have been plated in 100 µL of development medium. Infections have been initiated with 50 µL, and impedance (cell index) was recorded each 15 min. Measurements have been normalized 4 h earlier than an infection.
Immunoblotting
Immunoblotting was carried out as described beforehand, with blot improvement on X-ray movies (GE Healthcare) or the Biorad Chemidoc imager.12 Dot blots have been carried out to quantify the secretion of deca-His-tagged EpCAM/CD3-BiTE, as described beforehand.57 Nuclear and cytoplasmic fractionation was carried out utilizing the NE-PER™ Equipment in keeping with the producer’s directions (Thermo Scientific). Antibody dilutions and blocking circumstances are laid out in Supplementary Desk 4. Semi-quantitative evaluation of band depth was carried out by densitometry utilizing the ImageLab software program (Biorad), with depth normalization to the loading management of the identical run.
Cell cycle synchronization and evaluation
Cell synchronization was achieved utilizing a double thymidine block: 2 mM thymidine (Sigma) was added for 16 h, adopted by an 8-h launch, and one other 16-h block. For cell cycle evaluation, cells have been pulsed with 20 µM bromodeoxyuridine (BrdU, Sigma) for 10 min earlier than harvest. Cells have been subsequently indifferent utilizing trypsin, mounted in ice-cold 70% ethanol for 30 min, and handled with 2 M HCl + 1 mg·mL−1 pepsin (Sigma) for 20 min. After two PBS washes, cells have been stained with a major mouse anti-BrdU antibody (1:100, 90 min, BD Biosciences) and a secondary goat anti-mouse-488 Fab-fragment (1:500, 60 min, Thermo Fisher) in DPBS + 2% FBS. After washing, cells have been stained with 50 µg·mL−1 propidium iodide and 400 µg·mL−1 RNase A. Movement cytometry was carried out on an Attune stream cytometer (Thermo Fisher), and knowledge have been processed with FlowJo v10.0.7r2 software program (TreeStar Inc., USA).
Assay for promoter exercise
In whole, 5 × 10⁴ cells have been seeded in 24-well plates. The following day, 200 ng of plasmid per response (~600–800 pmol) and a pair of.5 µL Lipofectamine 2000 per 1000 ng DNA have been every diluted in 150 µL Optimem (Thermo Fisher), mixed, and incubated for 30 min earlier than including to cells. After in a single day incubation, the medium was changed to start out hypoxic publicity. Co-transfection was carried out with one twentieth of the transfected plasmid mass of a β-galactosidase-encoding plasmid (SV40-betaGal, Promega) to normalize for transfection effectivity. Cells have been washed with PBS, lysed, and subjected to at least one freeze-thaw cycle earlier than measuring luciferase exercise in black 96-well plates with luciferin reagent (Promega). Luciferase expression was normalized to β-galactosidase exercise, which was measured by incubating lysates with 2× ONPG buffer (137 mM HNa2PO4 + 63 mM H2NaPO4 + 2 mM MgCl2 + 0.7% (v/v) β-mercaptoethanol + 1.33 mg∙mL−1 ortho-Nitrophenyl-β-galactoside, pH 7.2) at 37 °C for 10 min. Reactions have been stopped with 1 M Na₂CO₃, and OD was measured at 410 nm.
Puromycin incorporation assay
World translation was assessed by pulsing cells with 1 µg∙mL−1 puromycin (Sigma) for 30 min. Pre-treatment with cycloheximide (100 µM) served as a adverse management. Lysates have been then subjected to immunoblotting.
Reverse transfection of siRNA
siRNA transfections have been performed at a ratio of 10 pmol siRNA to 1 µL RNAiMax (Thermo Fisher) in Optimem (Thermo Fisher). After mixing, the options have been incubated for 30 min earlier than plating 3 × 10⁴ cells (24-well) or 1.2 × 10⁵ cells (6-well). After in a single day incubation, the medium was changed with full medium to start out hypoxic remedy. siRNA sequences are listed in Supplementary Desk 5.
Sequence alignment of adenovirus genomes
Putative HREs have been recognized by handbook scanning of annotated promoters of Ad11p (GenBank: AY598970.1). Corresponding areas from 59 adenovirus genomes (Supplementary Desk 1) have been aligned utilizing the CLC Genomics Workbench (Qiagen). Nucleotide frequencies of the HRE motif throughout all genomes have been visualized as a sequence emblem.
Chromatin immunoprecipitation-qPCR (ChIP-qPCR)
In whole, 6 × 10⁶ cells have been plated onto 15-cm plates. Chromatin crosslinking was achieved with 1% methanol-free formaldehyde (v/v) for 10 min with light rocking, adopted by quenching with 125 mM glycine for 10 min. Cells have been washed twice on ice with PBS, scraped into 5 mL of PBS, and pelleted at 500× g. Pellets have been resuspended in SDS lysis buffer (1% SDS, 10 mM EDTA, 50 mM Tris pH 8.1) with protease inhibitors (1:30, Thermo Fisher).
Sonication was carried out at 4 °C utilizing a Bioruptor (Diagenode) for two:45 min (15-second pulses on/off, excessive energy) adopted by benzonase remedy (15 U, Milipore) for 25 min for sufficient fragmentation of viral and host chromatin. DNA fragmentation (~300 bp) was confirmed through TapeStation. Protein A agarose beads (40 µL, Millipore) have been pre-washed with ChIP diluent after which incubated with sonicated DNA for 1 h at 4 °C on an end-over-end rotator. As beforehand described,58 15 µL of HIF-1α (PM14), HIF-2α (PM9), HIF-1β (Novus NB100-110), or pre-immune sera (10 µL) have been used per ChIP response and incubated in a single day at 4 °C. After bead addition (90 µL), samples have been incubated for 1.5 h at 4 °C with end-to-end rotation, after which pelleted at 380×gn for 8 min. Washes (800 µL) have been carried out with low- and high-salt buffers and LiCl buffers at 4 °C for five min every. The samples have been pelleted at 380×gn at 4 °C for five min, then washed twice in 800 µL TE. A two-step elution (120 µL buffer every step) was carried out at room temperature for 15 min with shaking at 1400 rpm. For ChIP buffer parts confer with Supplementary Desk 7.
Reverse crosslinking was achieved by including 12.5 µL of 4 M NaCl and heating at 65 °C in a single day. Proteinase Okay (2 µl of 20 mg·mL−1) was added for 4 h at 45 °C, adopted by RNase A (1 µL) at 37 °C for 30 min. Precipitated DNA was purified utilizing MinElute columns (Qiagen) and eluted in 20 µL of DNase-free water. qPCR was carried out utilizing the two× SyGreenBlue Hello-ROX in 20 µL (PCR Biosystems), taking PCR effectivity into consideration (Supplementary Desk 6).
Statistical evaluation
All statistical analyses and plots have been carried out utilizing Prism v.10.6 (Graphpad). Replicates (n) representing organic variance are plotted as single knowledge factors, and technical replicates are indicated the place related. Bars signify the imply ± normal deviation, except in any other case acknowledged. For statistical evaluation, log-normal knowledge have been chosen to permit the usage of parametric checks. Two-sided unpaired t checks assuming unequal variance for conservative significance analysis have been carried out (Welch´s correction). Holm–Šidák correction was utilized for a number of comparisons.